
Many of our small business clients know that analytics should play a large role in their digital marketing decisions, but don’t necessarily know where to start. They have access to a Google Analytics account, but the options are overwhelming, and the reports contain foreign verbiage.
Let’s take a look at five of the most common and most insightful reports in Google Analytics:
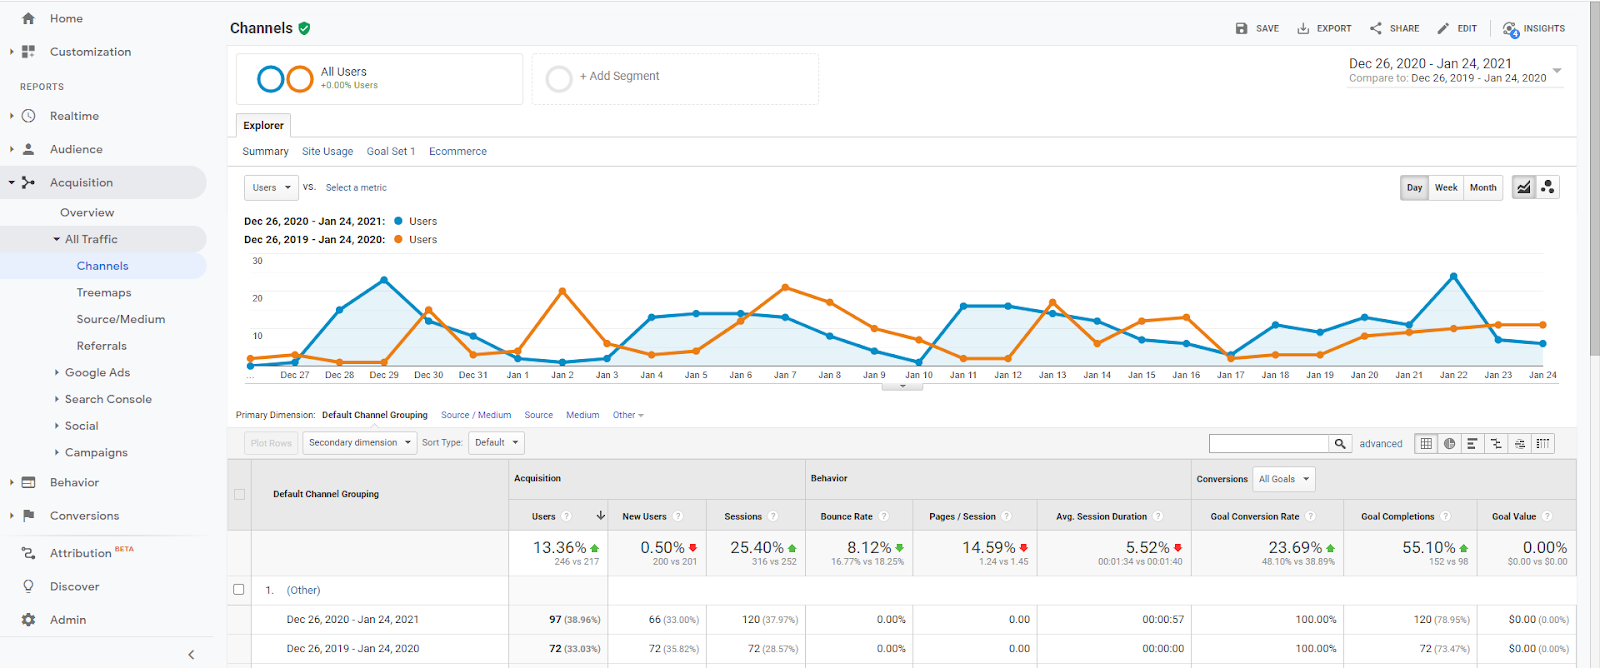
1. Channels Report
How to access this report:
Acquisition → All Traffic → Channels
Why you need this report:
This report will give you Users coming to your site and goal conversions by Channel.
- Users are “unique” people that come to your website, as opposed to impressions, which includes multiple visits by a single user.
- Goal Conversions are set up in Google Analytics in order to track performance such as phone calls and forms submitted online.
Make sure to choose a date range in the top right, with a “compare to” set as well. I prefer to compare my data to the previous year in order to remove any seasonality in the results.
While I spend very little time on the behavior columns like bounce rate, session duration, and pages per session, I spend a great deal of time with users and conversions.
Channels can include direct, organic, paid search, display, referral, social and more. Most of these channels are self-explanatory despite Google’s vague definitions. I use this report as a basic attribution for our services. If a client is subscribed to our SEO (search engine optimization) service, organic traffic is the key performance indicator, PPC (pay-per-click) is paid search, and so on according to the below:
- SEO = Organic
- PPC = Paid Search
- Local SEO = Other
- Display/remarketing = Display
- External Website link = Referral
- Facebook/other social = Social
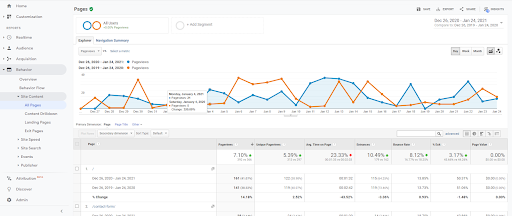
2. All Pages Report
How to access this report:
Behavior→ Site Content → All Pages
Why you need this report:
This report gives you the number of page views for every page on your website. After your homepage, what is your most important page? Are you getting users to that page or is there a site improvement that could be made to funnel users to that page? Conversion rate optimization (CRO) can have a huge impact on digital ROI.
Similar to the Channels report, make sure to add a date range with a “compare to” range to get the most out of this report. Customer needs tend to change over time, but it can also be that a change to a site menu or a call to action has improved or diminished the traffic to a key site page.
A/B testing different elements on a website is a great way to improve results with data and tracking the data with reports like the All Pages report will ensure the correct decisions.
Hint: Add a “secondary dimension” and click “page” to see page views by channel.
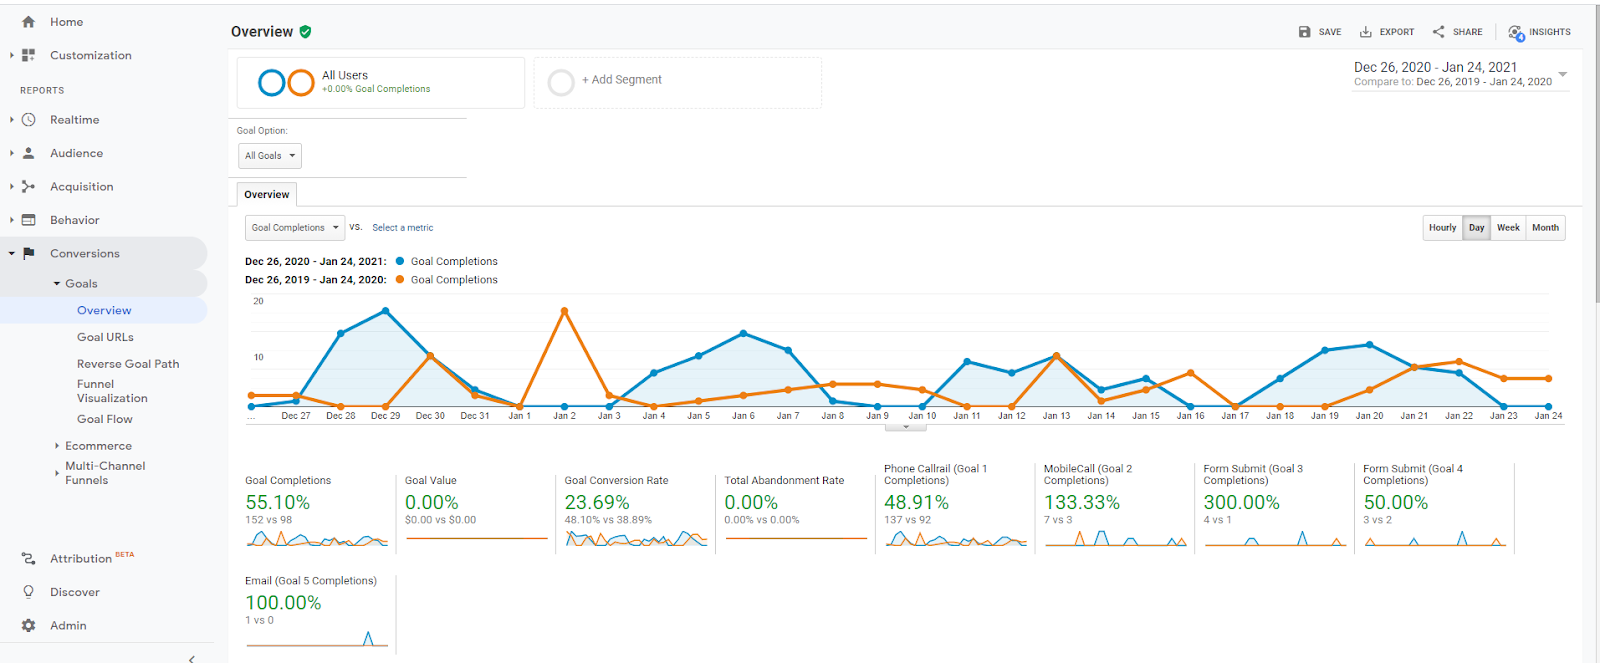
3. Goals Overview
How to access this report:
Conversions→ Goals → Overview
Why you need this report:
The Goals Overview report shows whatever goals you may have set up, whether it is a destination page, a button click, a phone call, or an online form submission. With the assistance of Google Tag Manager and an experienced digital marketer, you can track just about any actions on your site you could dream of.
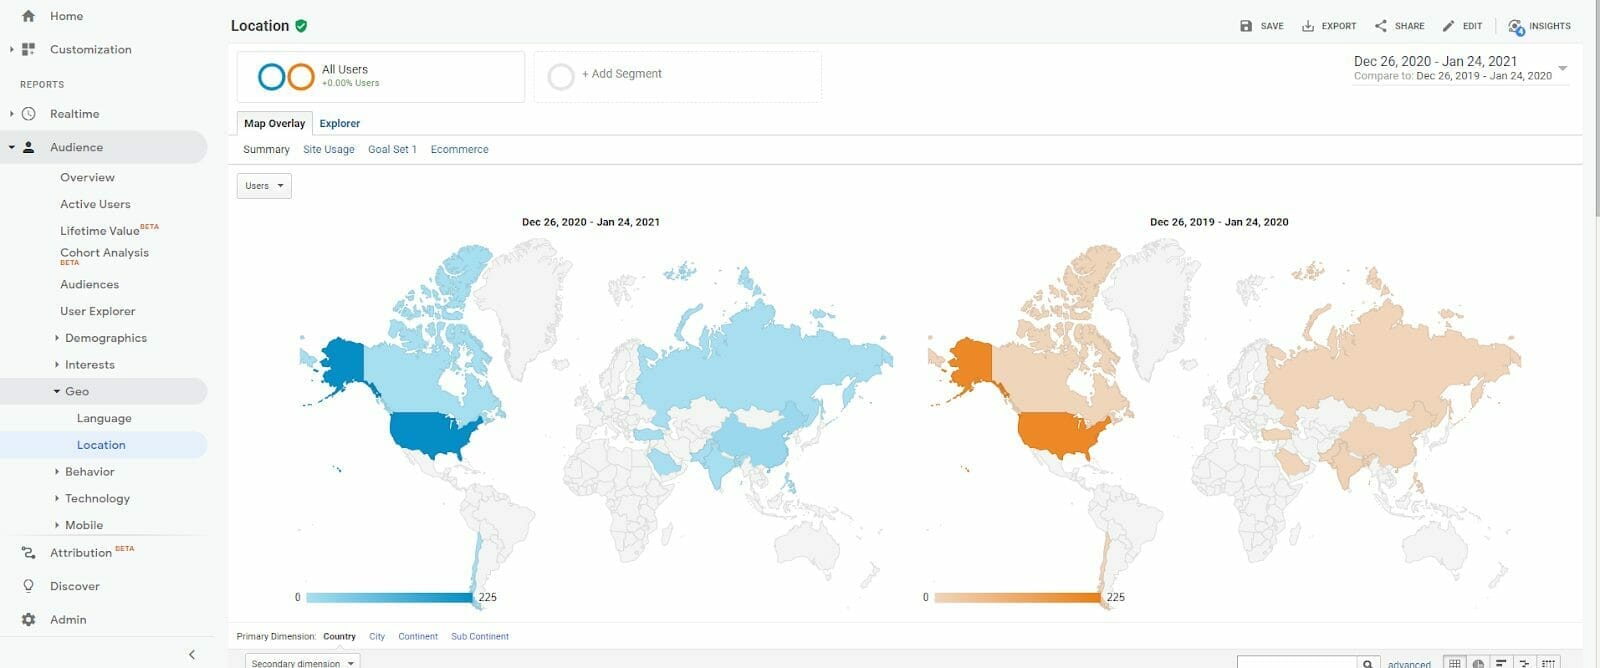
4. Location Report
How to access this report:
Audience→ Geo→ Location
Why you need this report:
If you are a small business it’s important to know what sort of a radius your customers are coming from. Beyond that, this report can help identify spam coming to your site. Amazon Web Services has a big hub in Ashburn, VA.
We constantly see traffic coming from this location and others that are simple bot traffic and need to be filtered out. Make sure that your traffic is coming from logical locations so you can assign an accurate conversion value.
5. Real-Time Overview
How to access this report:
Realtime → Overview
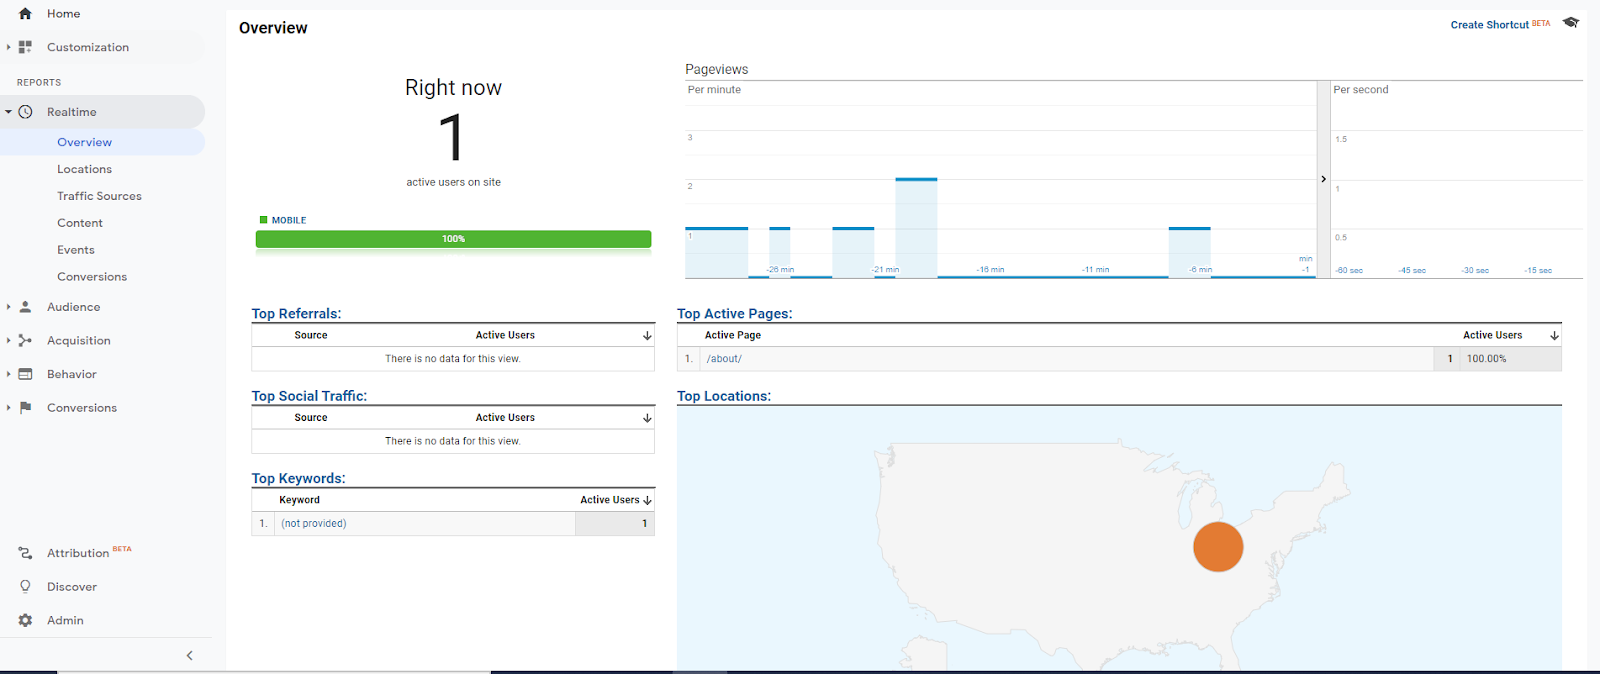
Why you need this report:
This report is as dangerous as it is useful. This report helps you watch users currently on your site and where they are coming from. But be warned, watching your visitors does not help them convert! A watched pot never boils!
I like this report to tell me if a campaign has launched successfully. Email or PPC campaigns that have some form of immediacy as it relates to user actions should show up fairly quickly in this report.
Google Analytics reports can be an incredibly useful tool when used strategically. It’s important to know which reports to rely on consistently, as well as which ones to weigh the causes and effects of changes to your site and the competition. Knowing what users are coming to your site, where they are coming from, and what they are doing while on your site can provide invaluable knowledge and feedback to make changes and improvements to your site. Checking Google Analytics reports consistently will ensure you always have a pulse on how your site is doing with your prospective customers.
If you are interested in learning more about how Google Analytics can improve your web traffic and presence, contact us today.